Bubble Chart
Description
A Bubble chart is a way of visualizing hierarchical data in the form of circles whose area is proportional to the value of the displayed record. Inside the circles of parent records the circles of child records can be nested. The arrangement of the circles is formed using packing program based on Grokker algorithm, modified for better display of hierarchical data [^1]. The principle of the Bubble is largely similar to the TreeMap chart.
Object captions are displayed in the center of the circle if there are no children or if their display is turned off. If the circle has child circles in the hierarchy, they are drawn with an offset downwards, and the text description is placed in the free space above these circles. If the caption cannot be displayed due to the small size of the free space in the object, the caption is not displayed. It is always possible to display the caption when hovering the mouse cursor in the tooltip. Values of very small values in relation to the parent object are not displayed in the chart.
The layout of the circles in the chart is formed completely automatically and depends on the values of the data source records. The size of the chart depends on the size of the rectangular area of the object. The circles are arranged around the center of the chart.
The data source for the Bubble chart is "HierarchicalDataSource".
Note that although the areas of the circles illustrate the values at the same level of the hierarchy, the area of the circle containing the display of nested values is not the same as the sum of the areas of those values - it is just an illustration of the grouping to display a nested hierarchy.
Switching to the visualization of one of the elements of the hierarchy is possible by double-clicking on the selected object. You can return to the previous hierarchy level by double-clicking on the circle illustrating the current hierarchy level or by using the navigation object "BreadCrumb".
Applications
A tree chart is suitable for comparing several hierarchies simultaneously, as well as for a visual comparison of values at the same level of the hierarchy.
When preparing the data source, you should pay special attention to the fact that the number of values at one hierarchy level should not be too large. Otherwise, the perception of the constructed chart can be difficult. You should also apply a preliminary grouping of small values in order to combine them into one value (for example: "Others"). When setting the maximum displayed depth property MaxDepth, it is also worth limiting to one or two levels to improve the perception of the chart.
By default, the values from the data source are interpreted as the area of the circle. The larger the value, the larger the area of the circle and vice versa. In some cases it can be useful to directly match the value from the data source to the diameter of the circle, for example when comparing the geometric sizes of objects (e.g., the sizes of planets). To enable this visualization mode, you must use the ValueViewType property. By default, this property contains a value of ValueViewType.Square, and it can be toggled to ValueViewType.Absoulute to display absolute values from the data source.
The appearance of the chart can be customized from the program code or by using the integrated Style editor.
Example
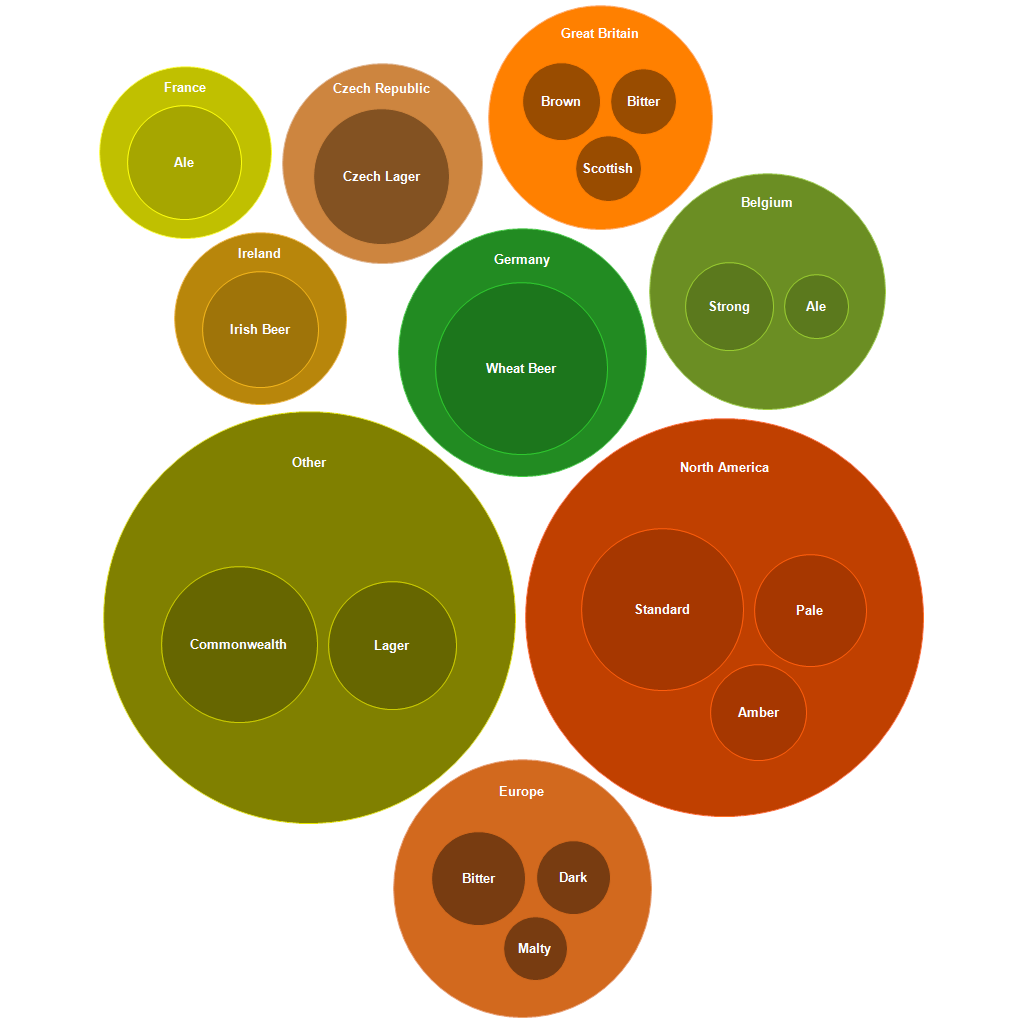
Below is an example of creating a hierarchical data source directly in the application code and saving a Bubble diagram to a file.
using (Bubble bubble = new Bubble())
{
    bubble.Width = 1024;
    bubble.Height = 1024;

    using (HierarchicalRecordsSource source = new HierarchicalRecordsSource())
    {
        source.BeginInit();
        HierarchicalRecord r = new HierarchicalRecord("Great Britain");
        r.Children.Add(new HierarchicalRecord("Bitter", 3));
        r.Children.Add(new HierarchicalRecord("Brown", 4));
        r.Children.Add(new HierarchicalRecord("Scottish", 3));
        source.Records.Add(r);
        r = new HierarchicalRecord("Ireland");
        r.Children.Add(new HierarchicalRecord("Irish Beer", 6));
        source.Records.Add(r);
        r = new HierarchicalRecord("North America");
        r.Children.Add(new HierarchicalRecord("Standard", 16));
        r.Children.Add(new HierarchicalRecord("Pale", 8));
        r.Children.Add(new HierarchicalRecord("Amber", 6));
        source.Records.Add(r);
        r = new HierarchicalRecord("Belgium");
        r.Children.Add(new HierarchicalRecord("Ale", 4));
        r.Children.Add(new HierarchicalRecord("Strong", 7));
        source.Records.Add(r);
        r = new HierarchicalRecord("Czech Republic");
        r.Children.Add(new HierarchicalRecord("Czech Lager", 8));
        source.Records.Add(r);
        r.Children.Add(new HierarchicalRecord("Czech Lager", 8));
        r.Children.Add(new HierarchicalRecord("Ale", 6));
        source.Records.Add(r);
        r = new HierarchicalRecord("Germany");
        r.Children.Add(new HierarchicalRecord("Wheat Beer", 12));
        source.Records.Add(r);
        r = new HierarchicalRecord("Europe");
        r.Children.Add(new HierarchicalRecord("Malty", 3));
        r.Children.Add(new HierarchicalRecord("Bitter", 6));
        r.Children.Add(new HierarchicalRecord("Dark", 4));
        source.Records.Add(r);
        r = new HierarchicalRecord("Other");
        r.Children.Add(new HierarchicalRecord("Lager", 13));
        r.Children.Add(new HierarchicalRecord("Commonwealth", 19));
        source.Records.Add(r);
        source.EndInit();

        bubble.DataSource = source;
        bubble.Palette.PaletteType = PaletteType.EarthTones;

        using (ImageExport export = new ImageExport())
        {
            export.ImageFormat = ImageExportFormat.Png;
            export.Export(bubble);
        }
    }
}
The result of the code can be seen in the following picture: