Description of the FastCube Library
The Grid
The Grid is an interactive tool for the presentation and analysis of data. There are multi-level headers in the left and top parts of the grid. The 'headers' are filled with the dimension values; there are both horizontal and vertical 'headers'. The central part of the grid displays the values of the measures.
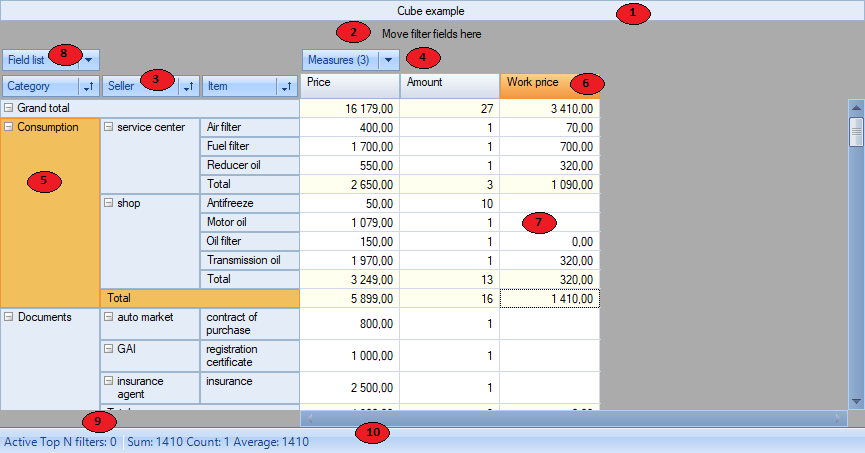
The grid consists of several regions, identified by numbers above:
- the grid title
- the filter region : dimensions included in this region can be used for filtering the grid data
- the vertical dimension headers : dimensions included in this region form the grid's vertical header
- the horizontal dimension headers : dimensions included in this region form the grid's horizontal header
- the vertical header of the grid
- the horizontal header of the grid
- data region
- the list of fields : the fields required for processing are dragged from the drop-down list : fields not required are dragged back to this list
- list of Top-N filters : filters can be modified through the context menu for this field
- the region showing aggregates for the selected cells : can be modified through the context menu