Drill Up/Down
Grid data can be collapsed (drilled up) to exclude the values of the dimensions located below from processing or can be expanded (drilled down). These operations are performed using the "-" and "+" buttons located on both headers of the grid.
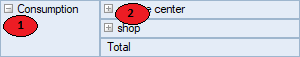
To group the data by the value of a certain dimension, you need to click the "-" button of the corresponding dimension. And conversely, to refine the data click the "+" button. These buttons are identified as '1' and '2' below:
- drill up button
- drill down button
Drilling up or drilling down changes the structure of the grid header and the data region. The two illustrations below show how the grid looks after drilling down on "service center" and then after drilling up on "Consumption":
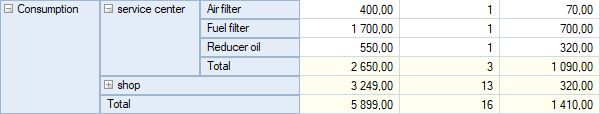

Only the main Total shows when a dimension item is collapsed.
It is possible to collapse the grand totals. The result depends on whether or not the "Measures" field is placed in the collapsed axis. An axis without measures collapses with the hiding of all the cells except the grand total cell. An axis with measures can collapse grand totals for each measure independently. The collapse of measure grand totals hides all the cells of that measure. Collapsing the grand totals of all the measures hides all the cells except the grand total cells for each measure.
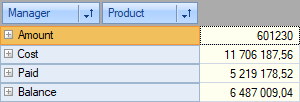
In this example the grand totals for measure "Amount" and "Cost" are collapsed:
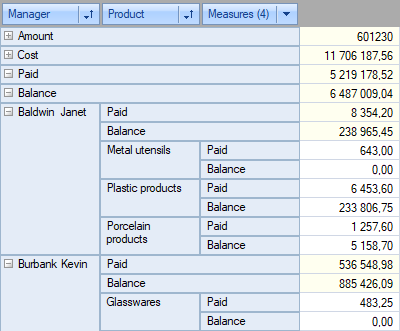
And here the grand totals for all the measures are collapsed: